Good afternoon! At the university, we were told that the spectrogram has two types, A and B. In the program, I have found only SDP A and SDP B while spectrograms do not seemingly have any types or kinds, only some other settings. Could you kindly tell me if it is possible to set a type of a spectrogram manually? Also, what do SDP A and SDP B stand for and why are they constantly inavailabe?
Mr. Tuman,
Sorry for the delay in responding.
Regarding your questions:
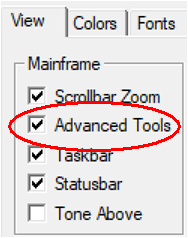
First launch Speech Analyzer, and show just the Waveform area. On the main menu, in “Tools/ Options” be sure that “Advanced Tools” is selected (see photo).
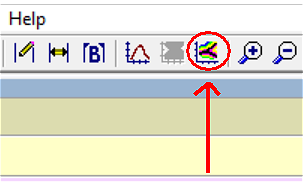
The following tests do not require Formant tracking, so I suggest that you turn off “Formant tracks” by making sure the button is not pressed (see photo).
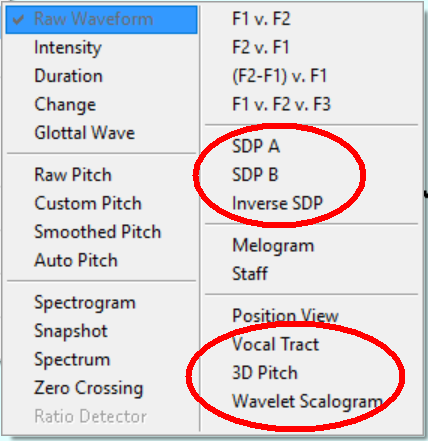
Now do a right mouse click in the Waveform area, and then move the mouse to point at “Types”. This will show a list of options, but some are grayed out.
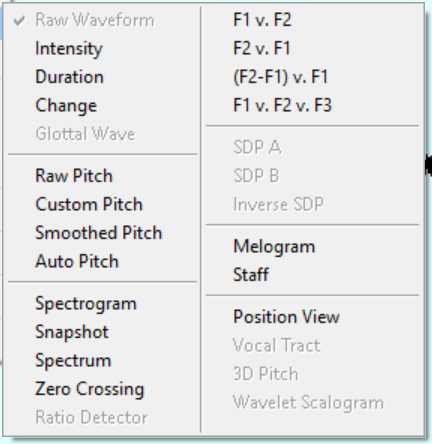
Then click in the Waveform area to close the pop-up. The again do a right mouse click in the Waveform area and then hold down the Control key first, and then moving the mouse to point at “Types”. This will show the same list as before, but with 6 additional items (I put a red circles around them). Then click in the Waveform area to close the pop-up.
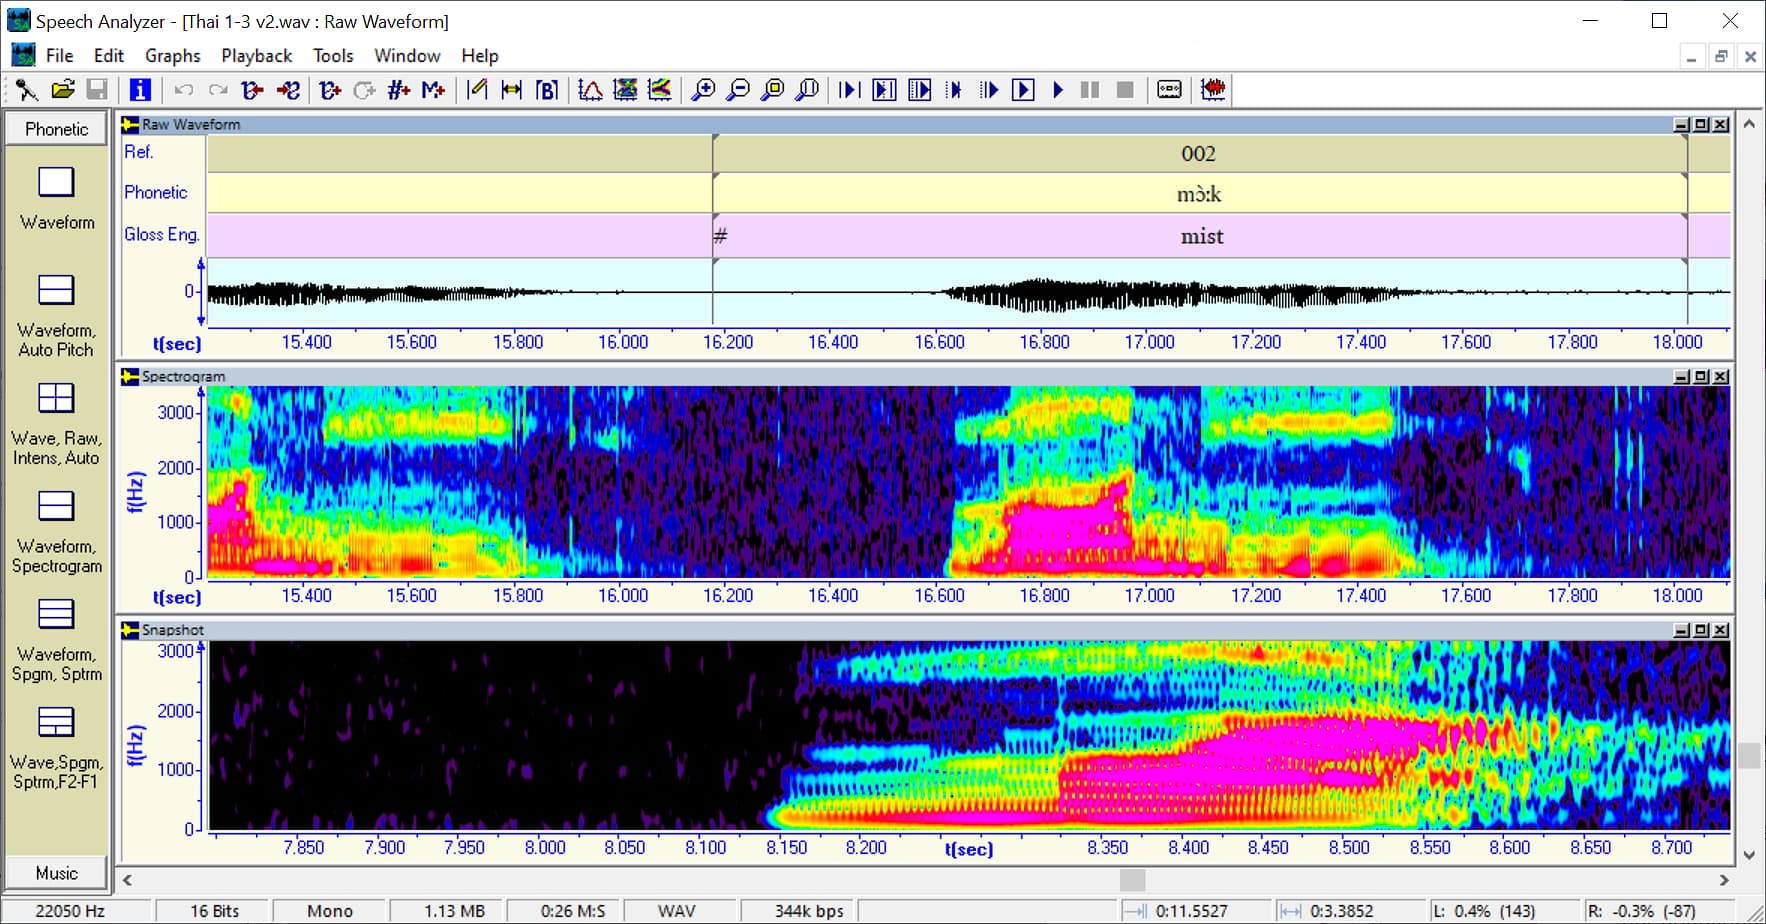
In the far left vertical column, select “Waveform, Spectrogram”. Do a right mouse click in the Spectrogram plot, and selecting parameters will among other things enable you to show the Color mode.
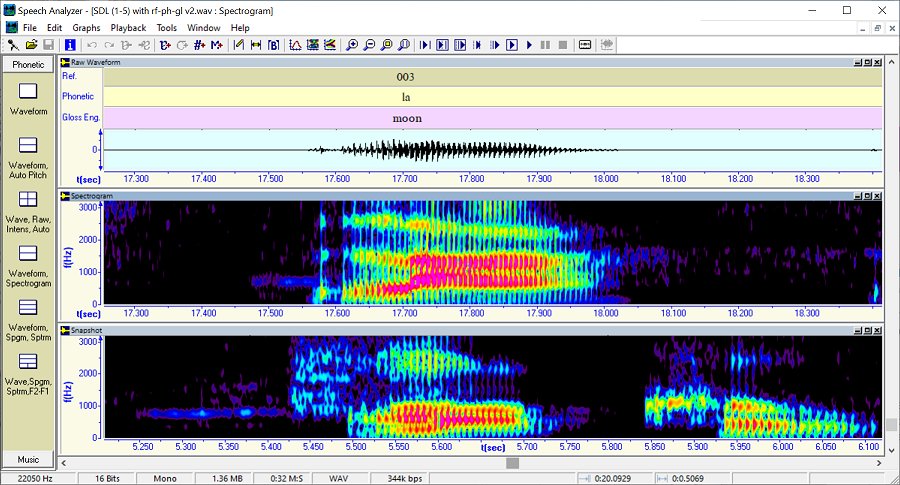
Again in the far left vertical column, select “Waveform, Spgm, Sptrm”, you will then also see a Spectrum plot. If you do a right mouse click in that area, and select Types and Snapshot you will see a blank area. After aligning the left and right cursors, then click the main menu item at the top of screen labeled “Snapshot Spectrogram”. It will not move when the main Spectrogram moves left and right. This allows a user to compare two different Spectrograms plots at the same time.
For your other question, SDP stands for “Spectrogram Display Plot”. There are two graphs “SDP A” and “SDP B”.
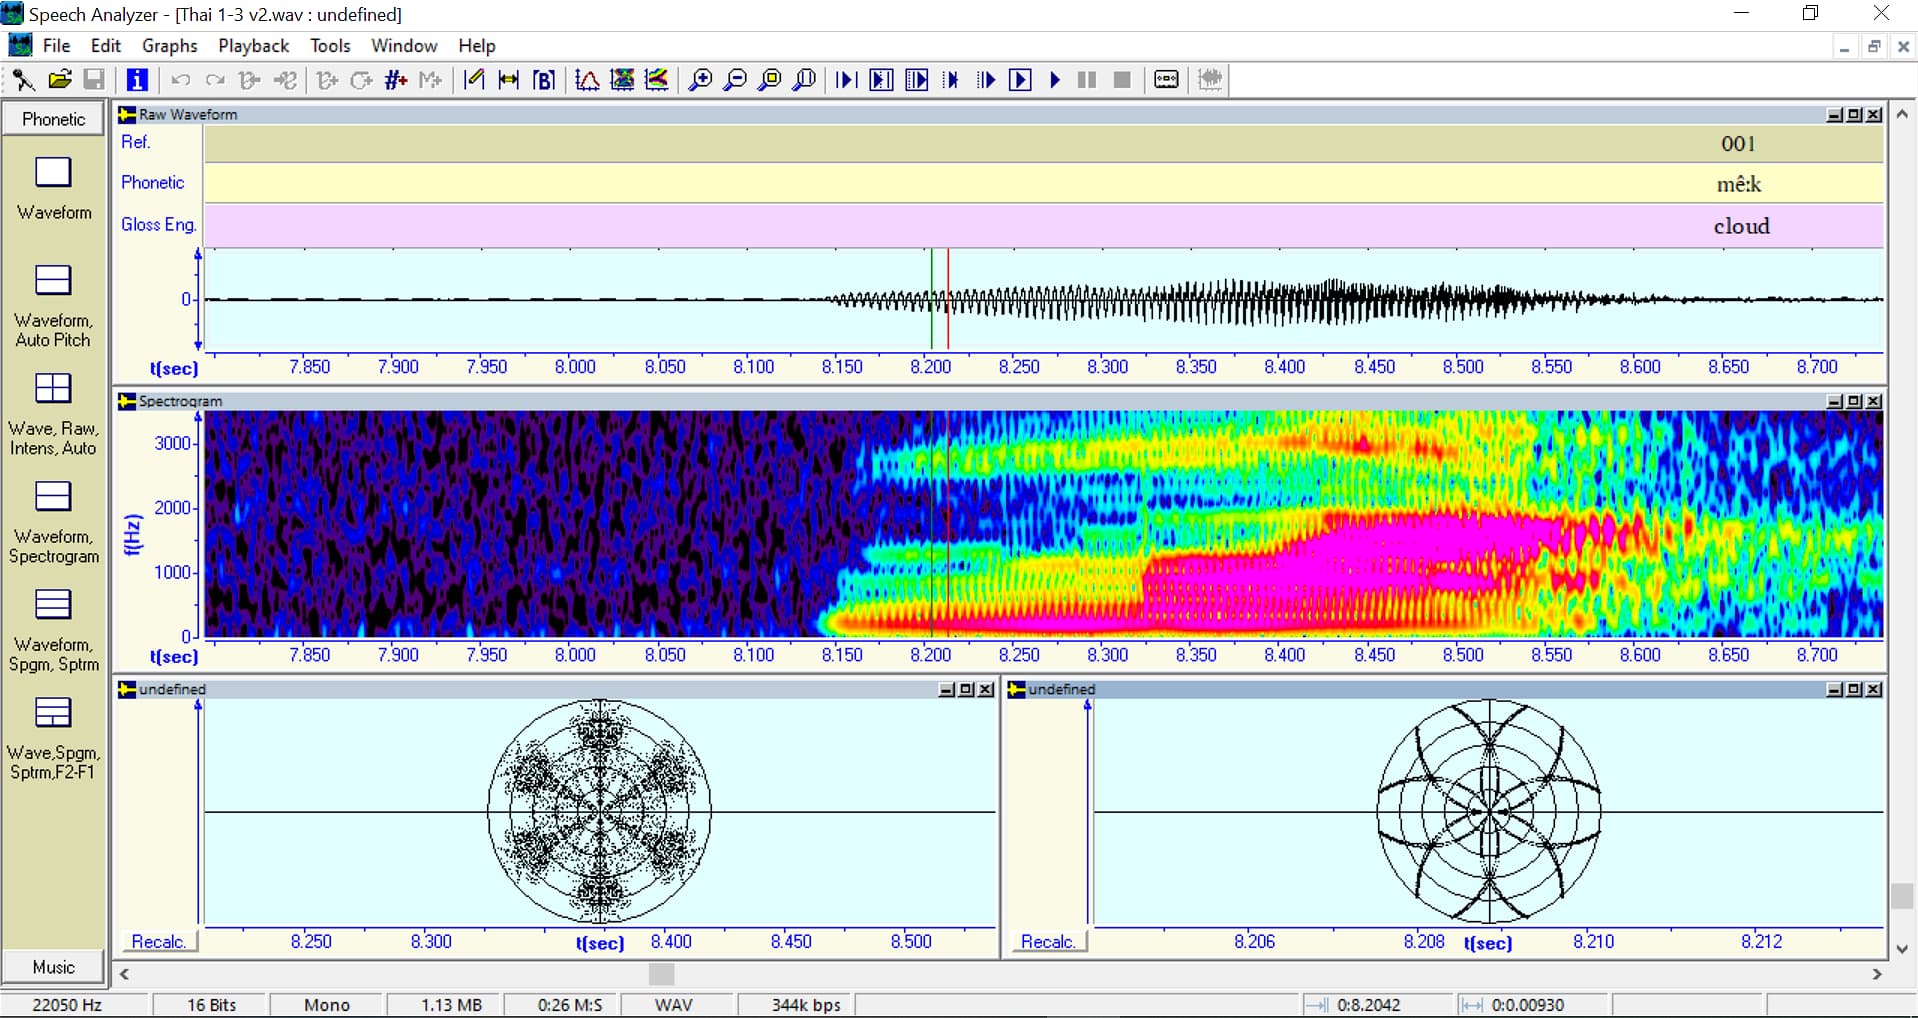
If you select “Waveform, Spectrogram” and then put the mouse pointer in the Spectrogram plot window, and do a right mouse click and select Layout and select 4c, then you will have 2 empty windows at the bottom of the screen.
If you do a right mouse click in the left undefined “Blank Graph” area and first holding down the Control key, and then moving the mouse to point to “Types”; then you can select SDP A. Next move the left and right cursors in the Spectrogram plot to select an area of interest, and then press the “Recalc” button in the bottom left corner of the window.
The same process will work for SDP B when using the other undefined “Blank Graph”.
Terry
Mr. Tuman
It has occurred to me that there is another meaning to your question regarding the comment “… we were told that the spectrogram has two types …”. That is Speech Analyzer can display 2 Spectrograms at the same time. The first Spectrogram works as expected, the Snapshot Spectrogram works in a different way.
To show how they work together, first open a file and then display a Spectrogram as usual. Then zoom into an area of interest in the Spectrogram. Then do a right mouse click in the Spectrogram and select “Layout” and then select 3A. You will then see an “Undefined” chart below the Spectrogram. In the “Undefined” chart do a right mouse click and select “Types” then select “Snapshot”. The Spectrogram and the Snapshot are now the same. The Raw Waveform and Spectrogram are free to move around, but the Snapshot will not move. The Snapshot can be updated so that it will match the Spectrogram view by doing a right mouse click in the “Snapshot” and selecting “Snapshot Spectrogram” and “Enter”. Attached is 2 Spectrogram layout.